Analyses
2025-2026 forecasting season
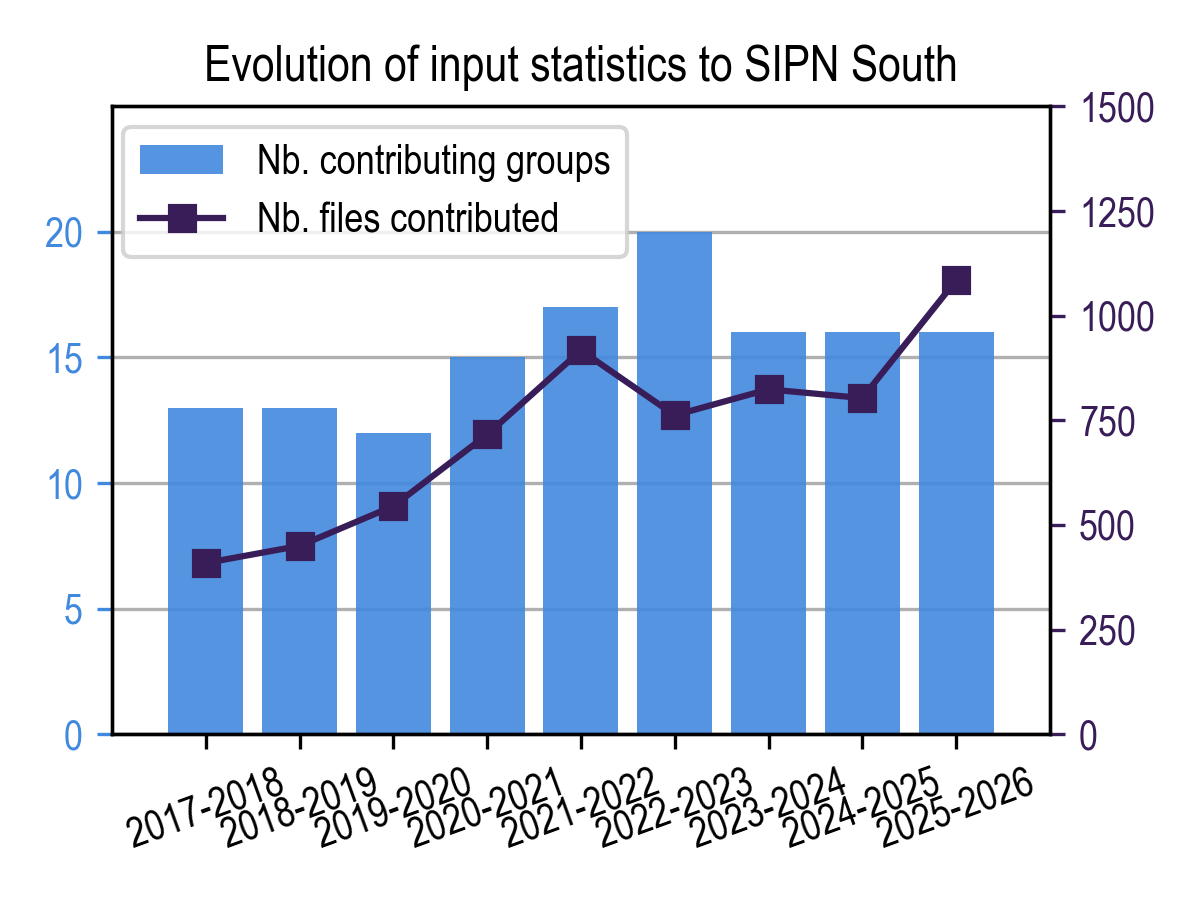
SIPN South organizes the 9th forecasting season of its young history.
Due to the cessation of the production of the OSI-401-b and NSIDC-0081 products (due itself to the planned decommissionning of SSMI sensors), the analyses from this forecasting season will rely on OSI-408, as well as the NSIDC-0803 AMSR-based products.
We warmly thank the following groups for contributing a forecast this year:
| # | Contributor name | Short name (in figures) | Forecasting method | Ensemble size | Initialization date* | Forecast reception date | Diagnostics provided |
|---|---|---|---|---|---|---|---|
| 1 | AWI | AWI-CPS | Dynamical model | 30 | 30th November 2025 | 10th December 2025 | SIA+rSIA+SIC+SIV |
| 2 | BCCR | BCCR | Dynamical model | 60 | 1st December 2025 | 22nd December 2025 | SIA+rSIA |
| 3 | BSC | BSC | Dynamical model | 50 | 1st November 2025 | 13th January 2026 | SIA+rSIA+SIC+SIV |
| 4 | CMCC | cmcc | Dynamical model | 50 | 1st November 2025 | 10th December 2025 | SIA+rSIA+SIC |
| 5 | Climatological forecast | climatology | Statistical; ensemble of all 30 previous years | 30 | 28 February 2025 | 18th December 2025 | SIA+rSIA+SIC |
| 6 | ECMWF | ecmwf | Dynamical model | 51 | 1st December 2025 | 22nd December 2025 | SIA+rSIA |
| 7 | GFDL | gfdl | Dynamical model | 30 | 1st December 2025 | 6th February 2026 | SIA+rSIA+SIC |
| 8 | IOCAS | IOCAS-SIPnet | Statistical model | 5 | 1st December 2025 | 12th December 2025 | SIA+rSIA+SIC |
| 9 | Lamont | Lamont | Statistical model | 1 | 30th November 2025 | 10th December 2025 | SIA+rSIA+SIC (interpolated) |
| 10 | Meier (NSIDC) | Meier-NSIDC | Statistical model | 1 | 1st December 2025 | 23 December 2025 | SIA |
| 11 | Met Office | MetOffice | Dynamical model | 42 | 30th November 2025 | 2nd December 2025 | SIA+rSIA+SIC |
| 12 | SYSU/SML | SYSU/SML-ConvLSTM | Statistical model | 1 | 1st December 2025 | 8th December 2025 | SIA |
| 13 | SYSU/SML | SYSU/SML-MLM | Statistical model | 1 | 1st December 2025 | 8th December 2025 | SIA+rSIA+SIC |
| 14 | SYSU/SML | SYSU/SML-KNN | Statistical model | 1 | 1st December 2025 | 8th December 2025 | SIA+rSIA+SIC |
| 15 | UCLouvain | ucl | Dynamical model (ocean-sea ice) | 10 | 1st of December 2025 | 15th December 2025 | SIA+rSIA+SIC+SIV |
*Initialization date is defined as the date of the last information used to generate the forecast
Post-season verification graphs
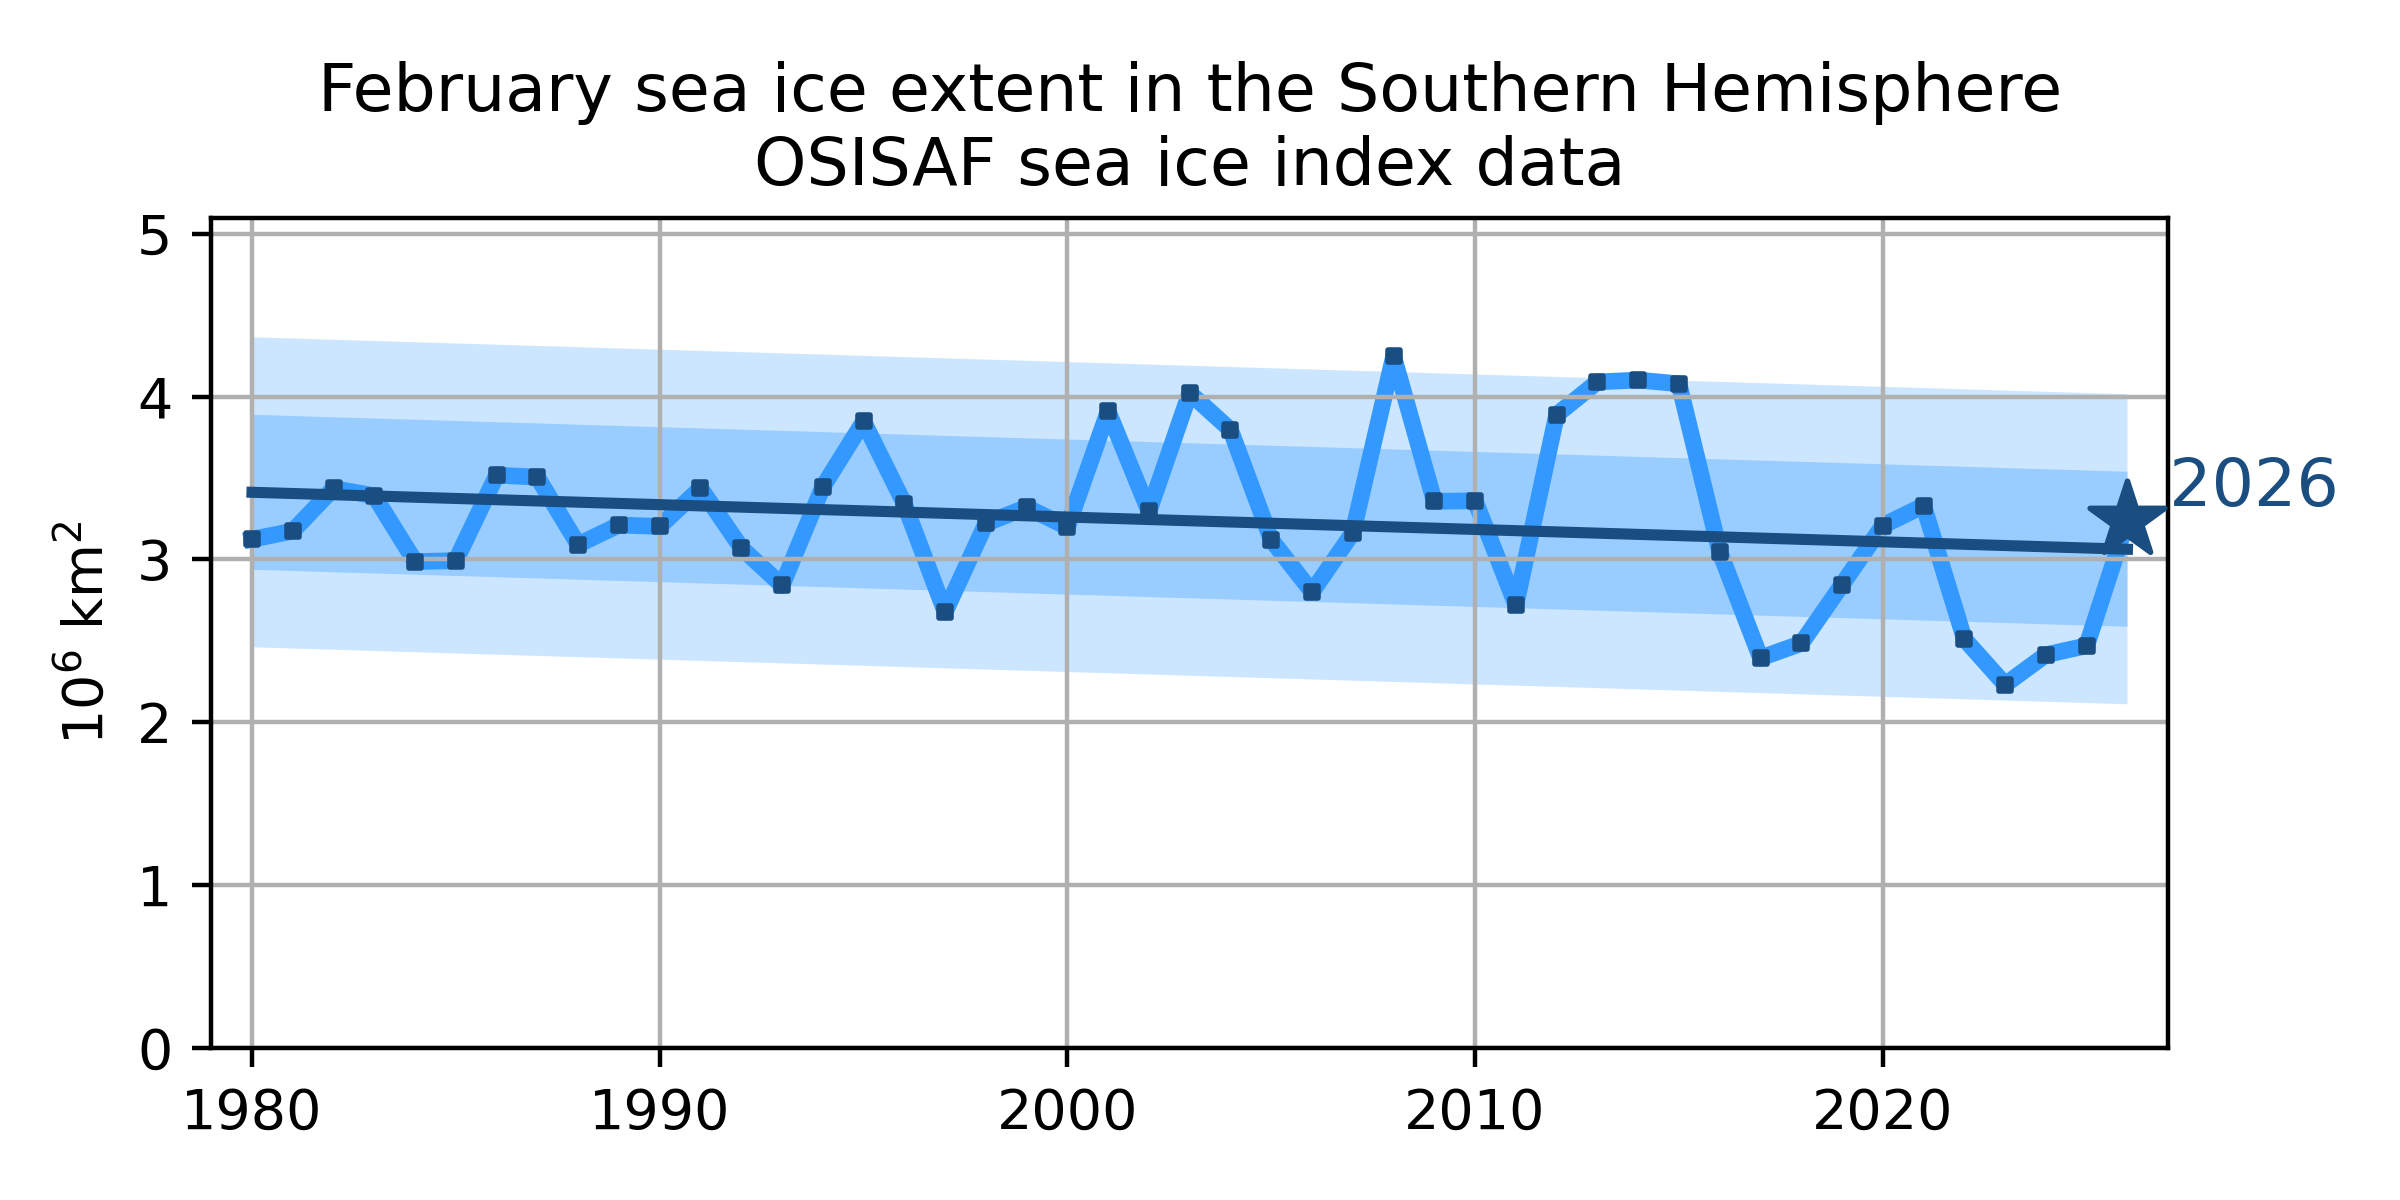
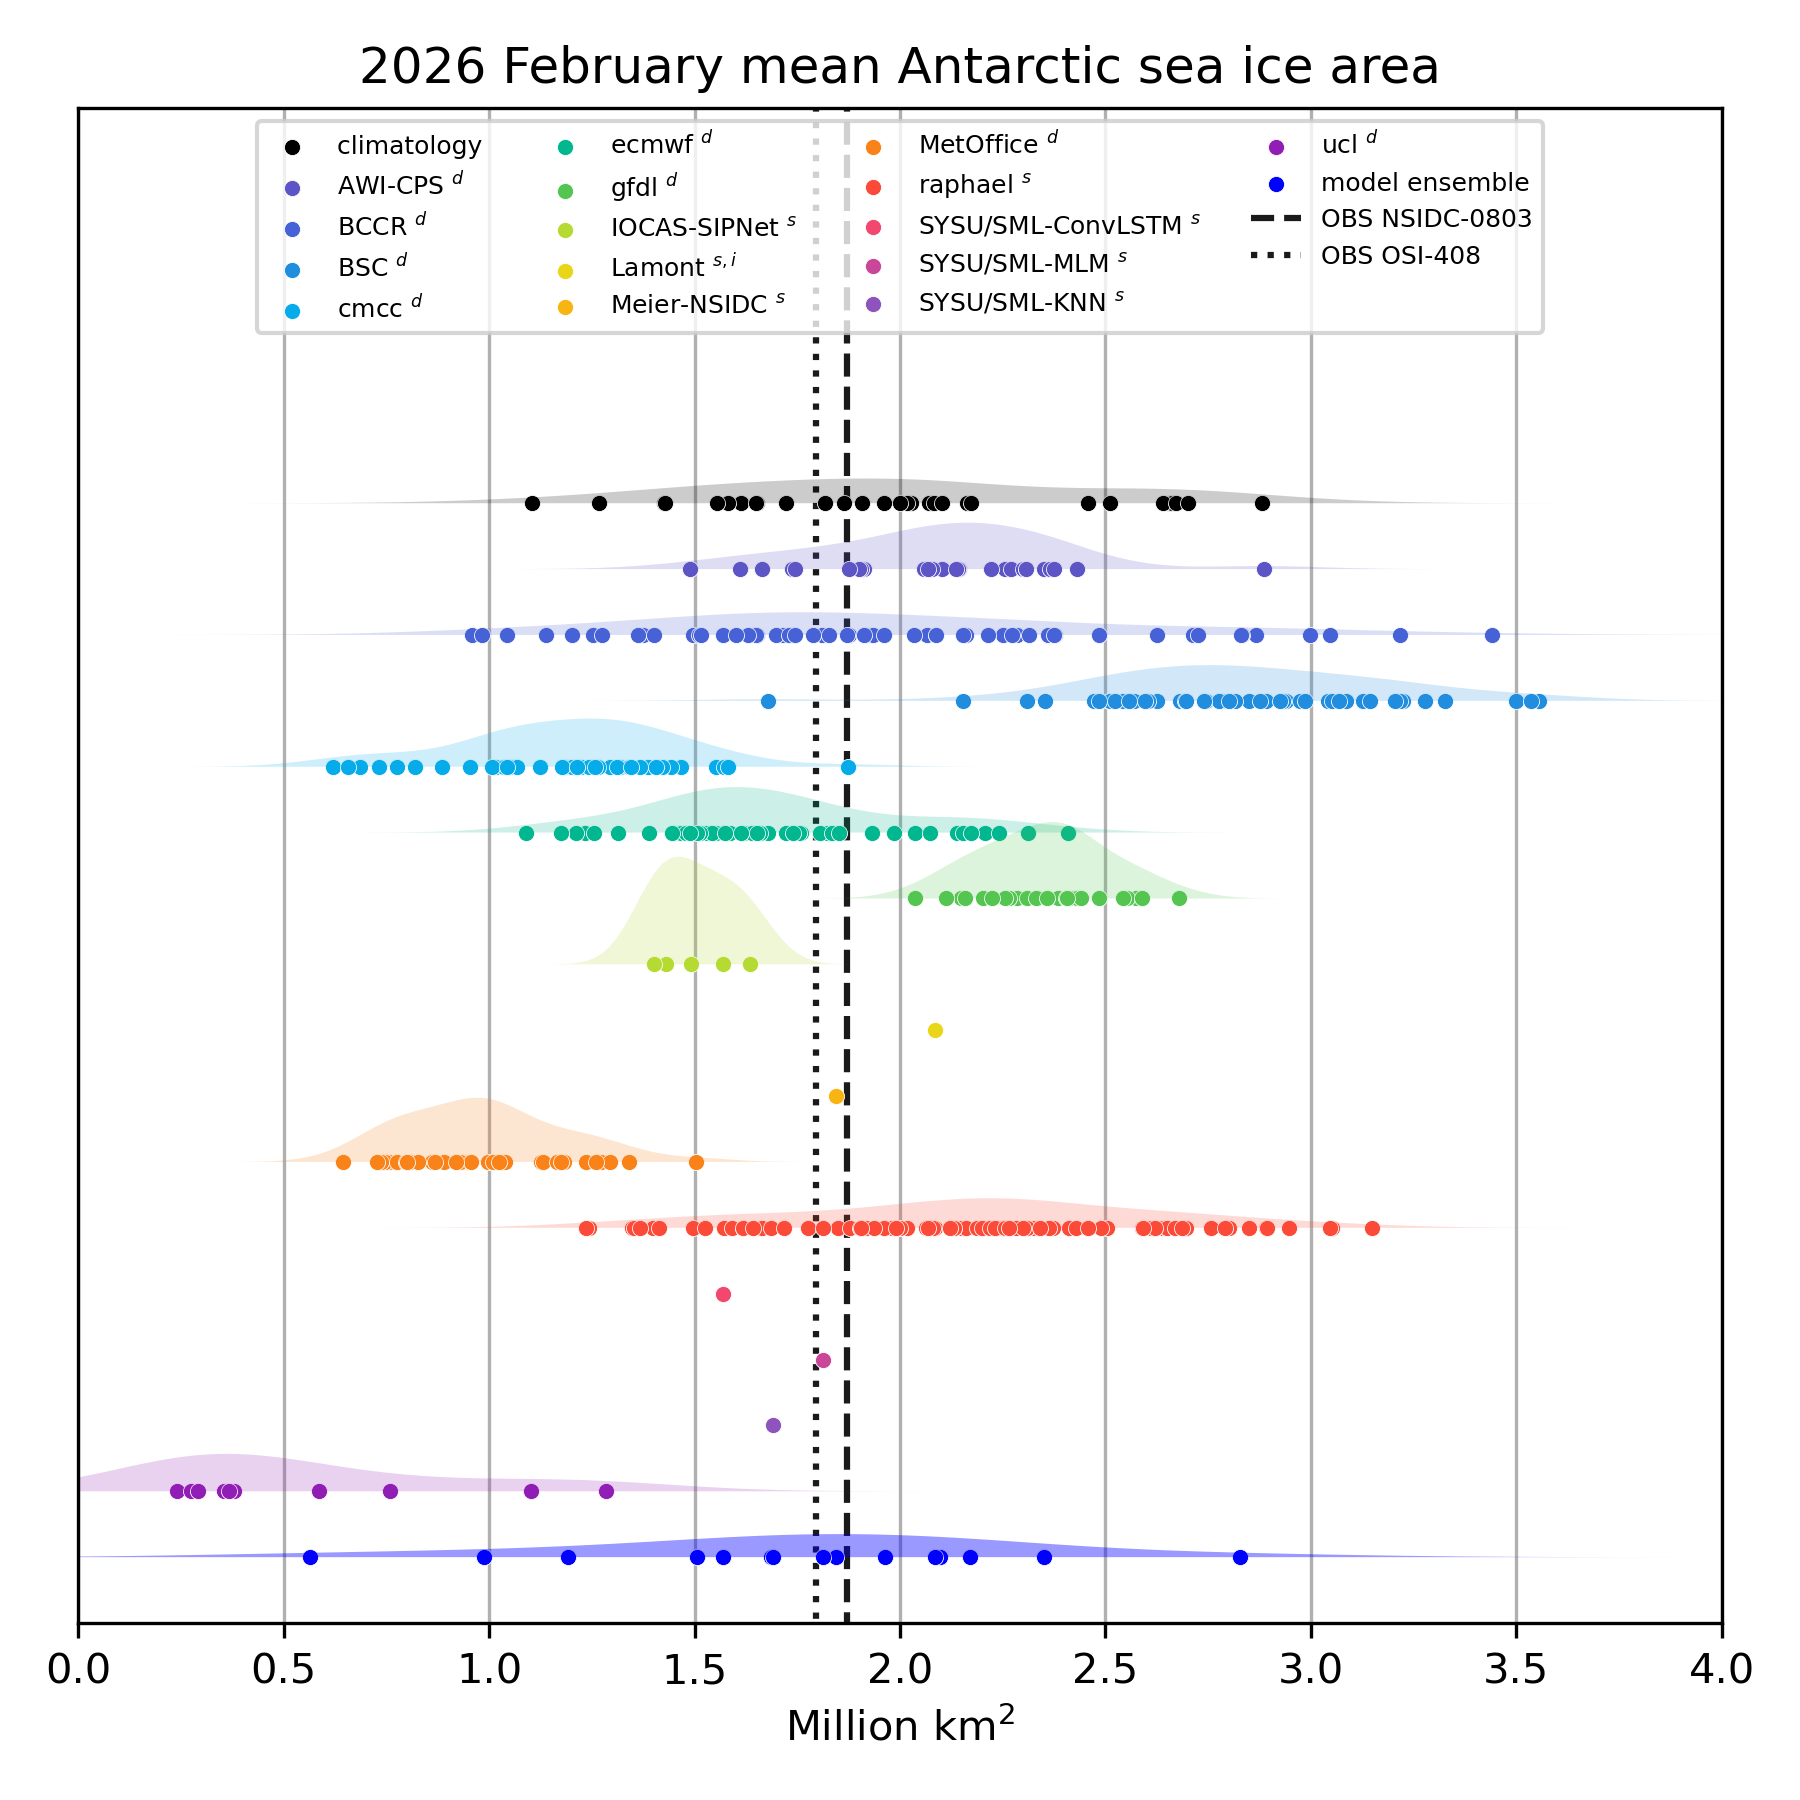
With 3.24 million km², February mean Southern Ocean sea ice extent was near climatological levels. This year’s value represents a marked rebound compared to 2025.
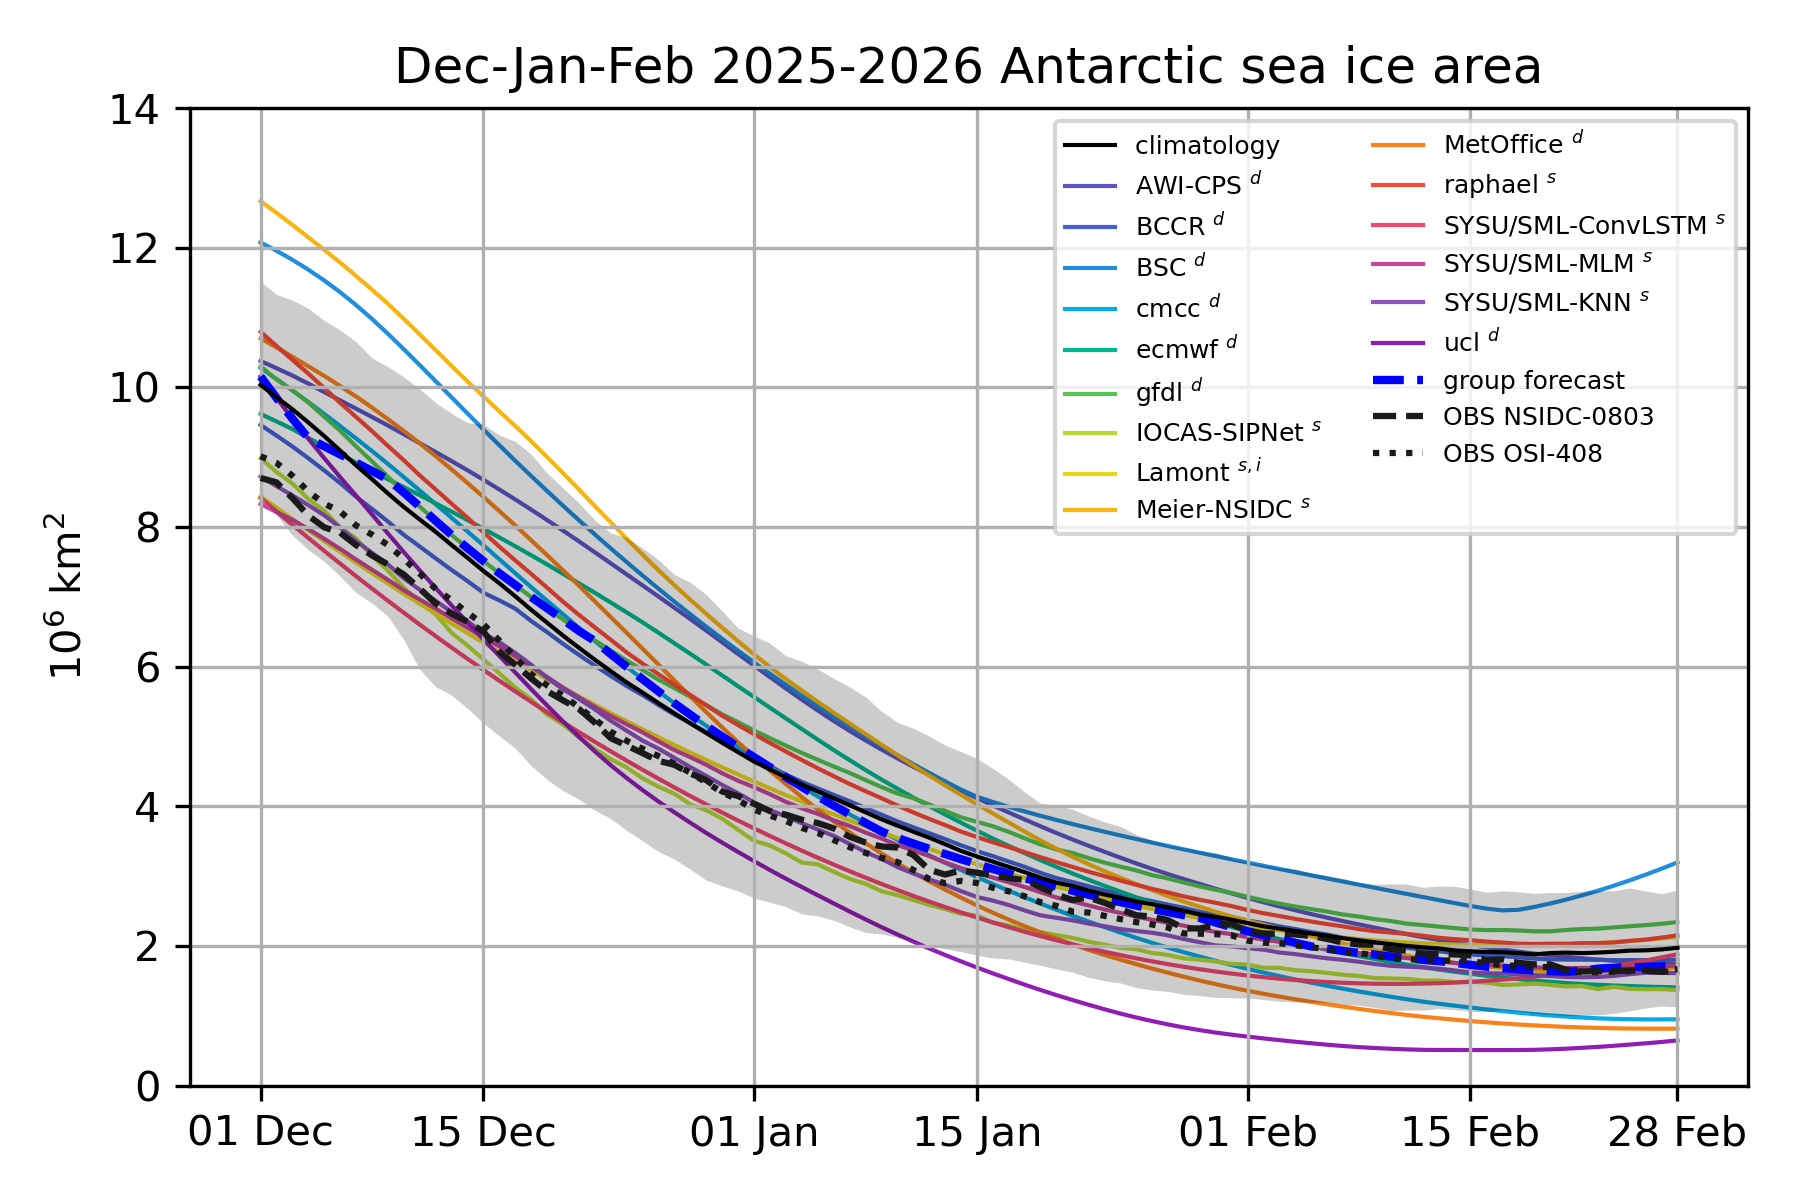
The SIPN South ensemble produced forecast sea ice extents that lie within the climatological distribution, and the group forecast matched the observations well in summer. The discrepancy is more clear in the late spring/early summer season where an overestimation takes place in several groups.
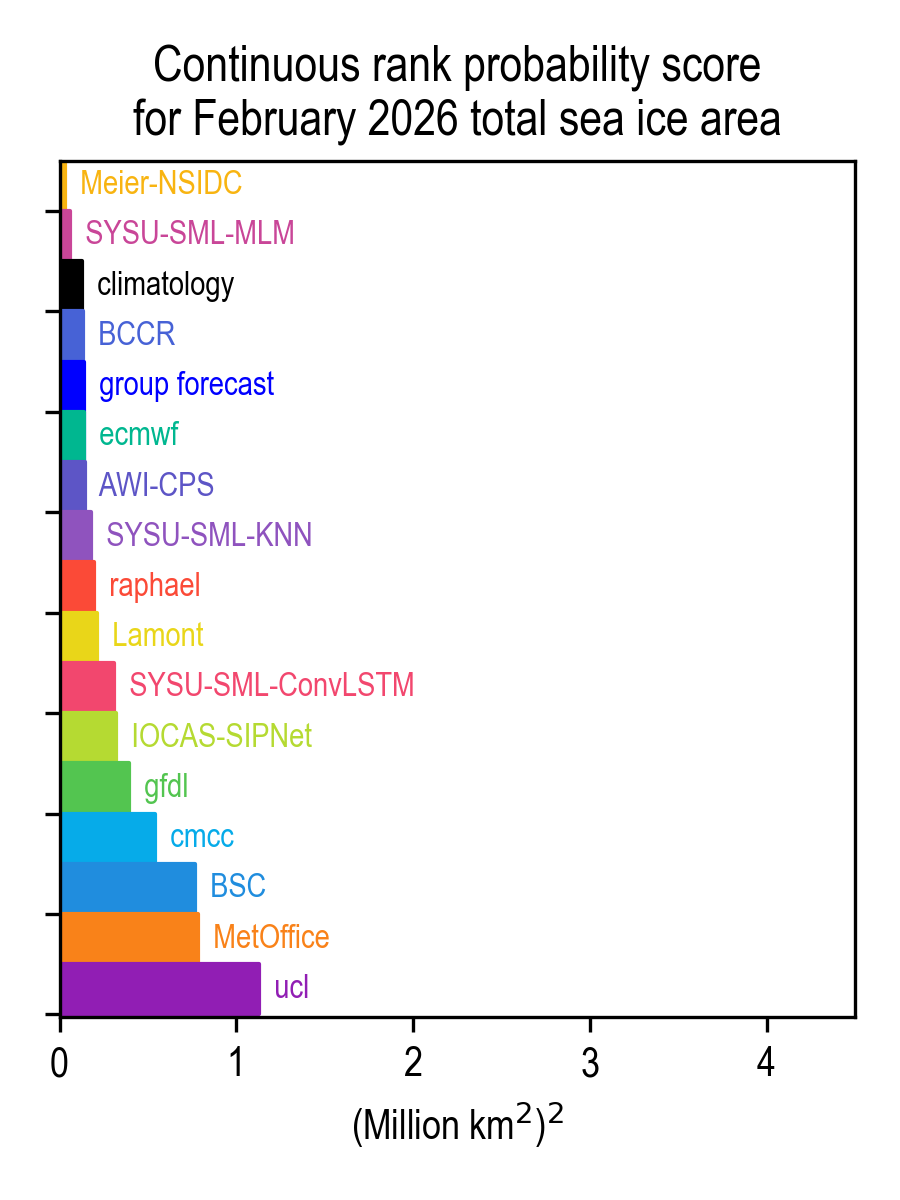
To quantify the relationship between bias and ensemble spread, we use the Continuous Rank Probability Score as in Massonnet et al. (2023). The CRPS is a convenient metric because it penalizes forecasts that are either biased (high or low) or excessively spread out. According to the definition, a CRPS of zero is obtained for a perfect forecast with the mass of the distribution concentrated at the verifying observation value. An interesting feature of this year’s forecast is that the group ensemble ranks in the top 5 of the submissions, along with the climatological forecast.